
Cloud Engineer

Cloud Engineer
#knowledgesharing #level 300
Fully Automated MLOps Pipeline – Part 2
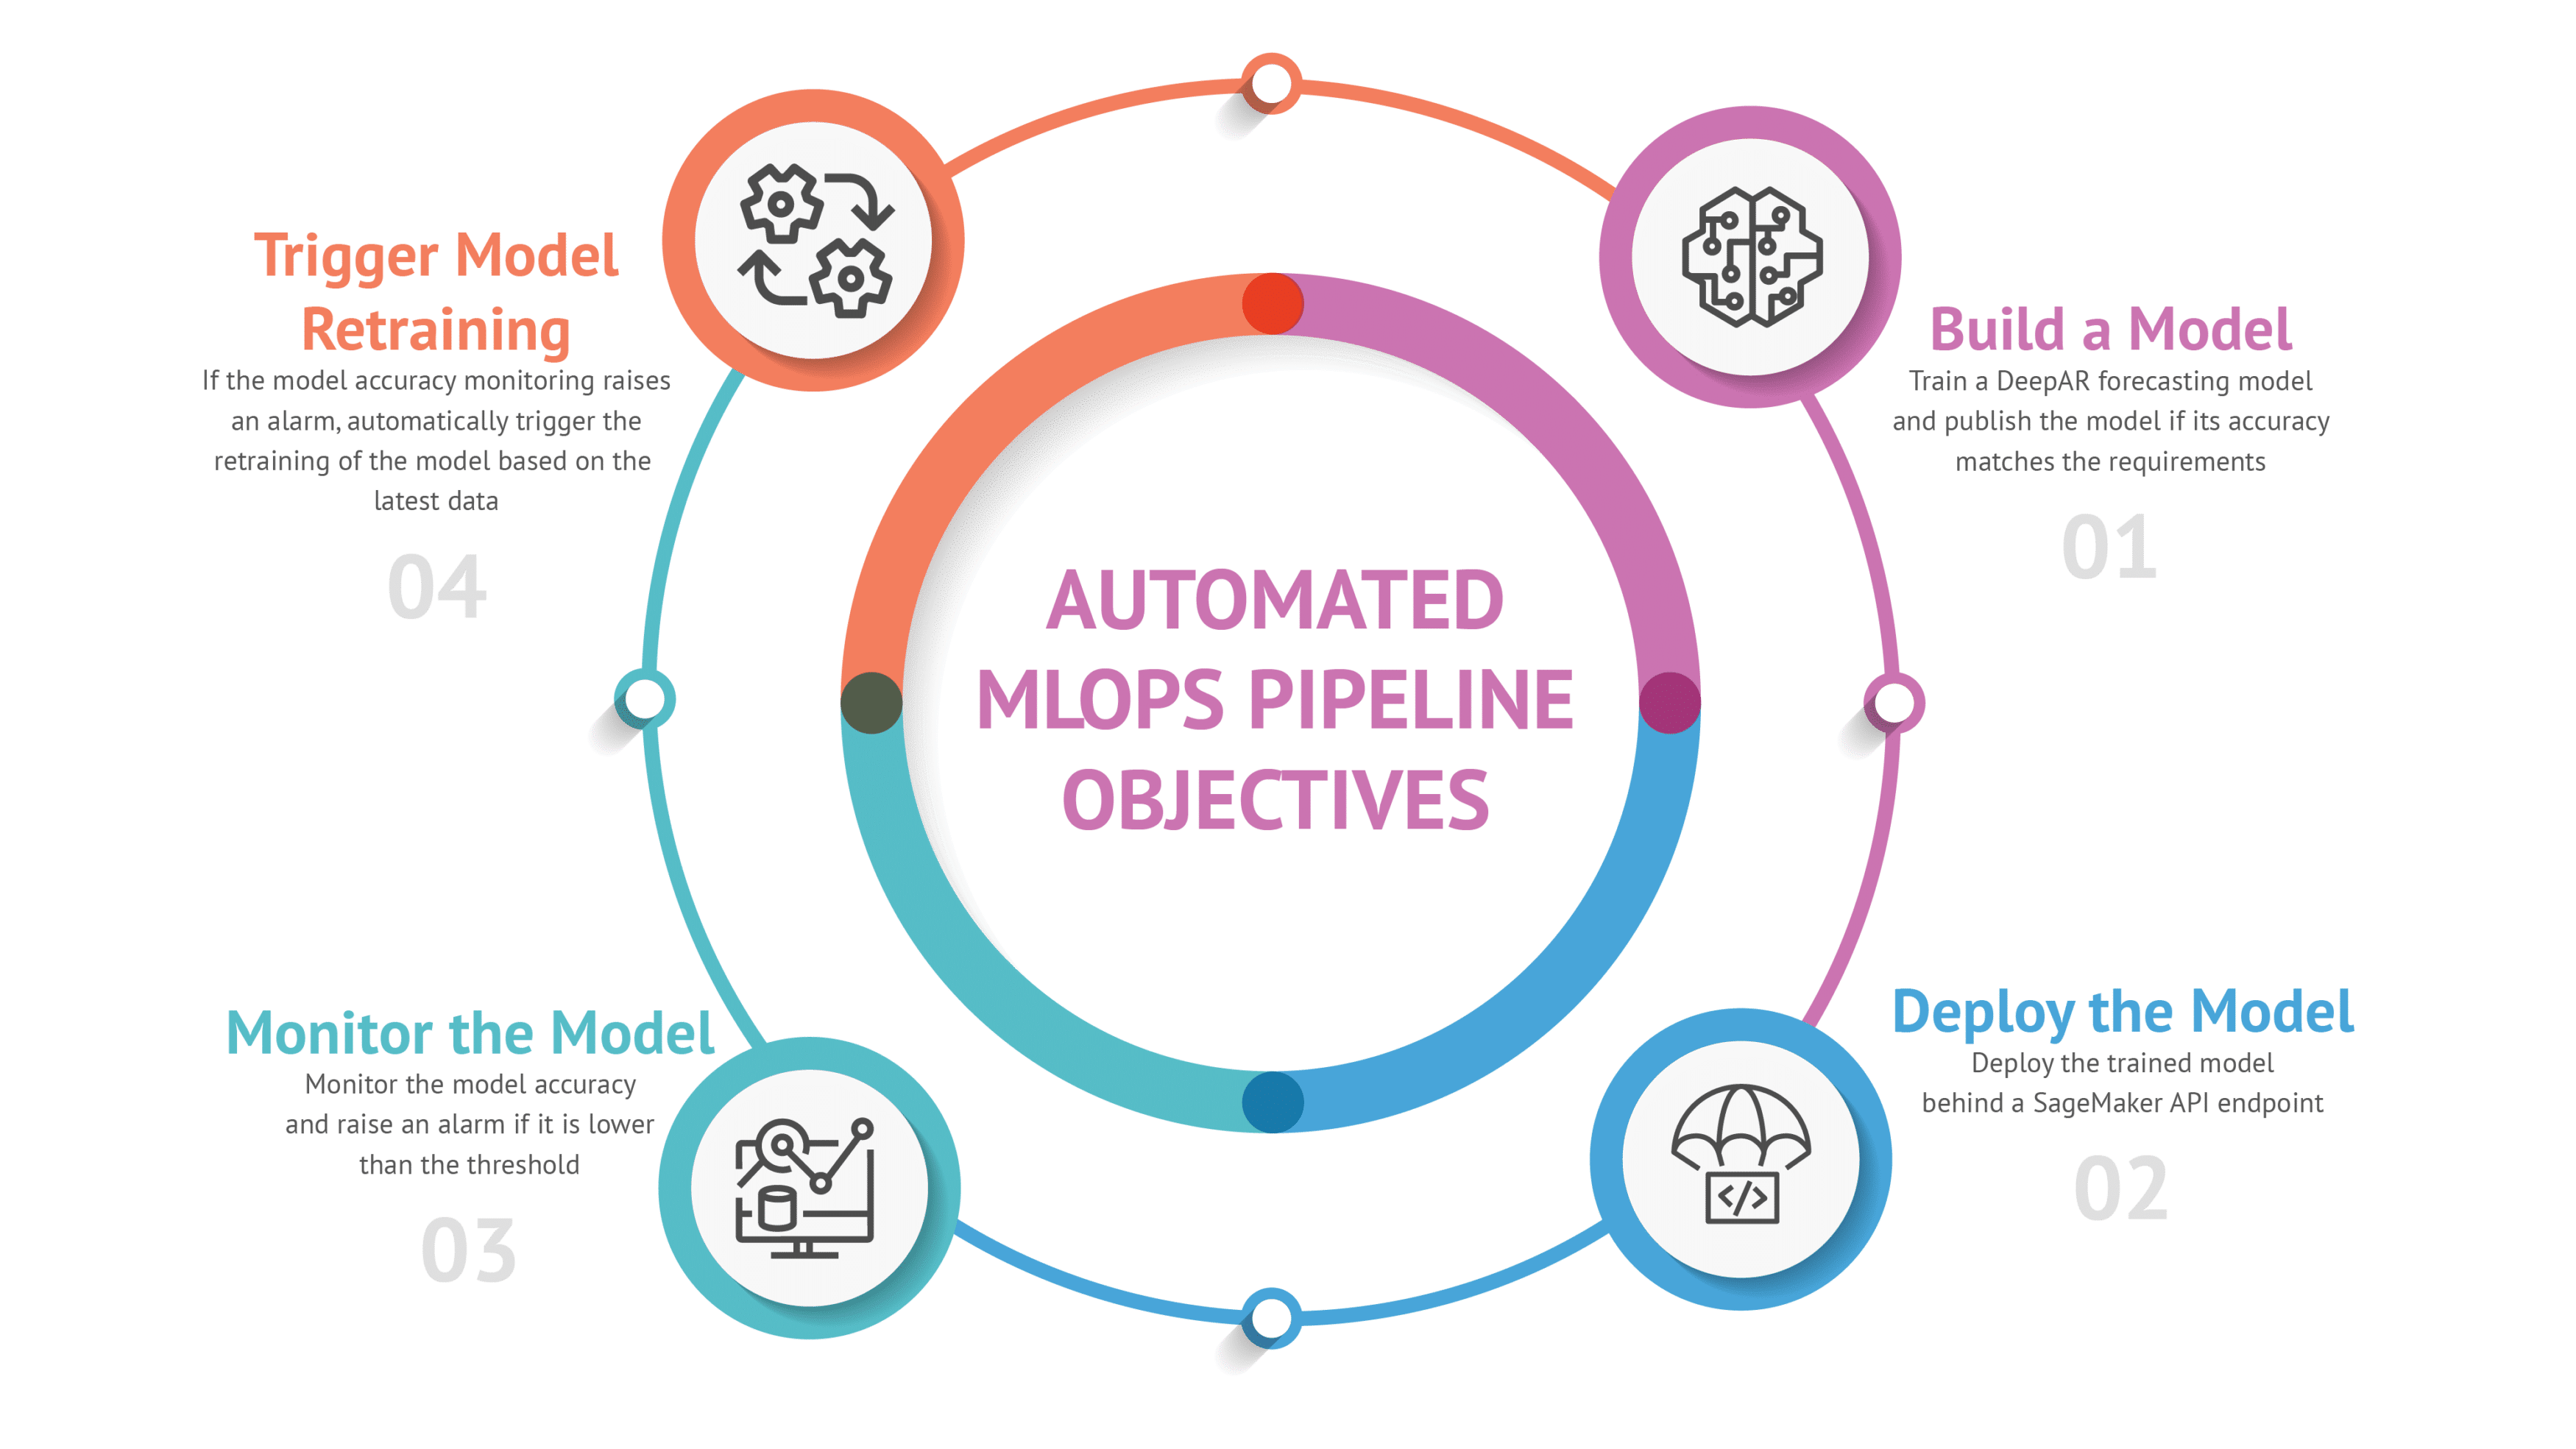
The Objective
The Model and Architecture
Model Monitoring
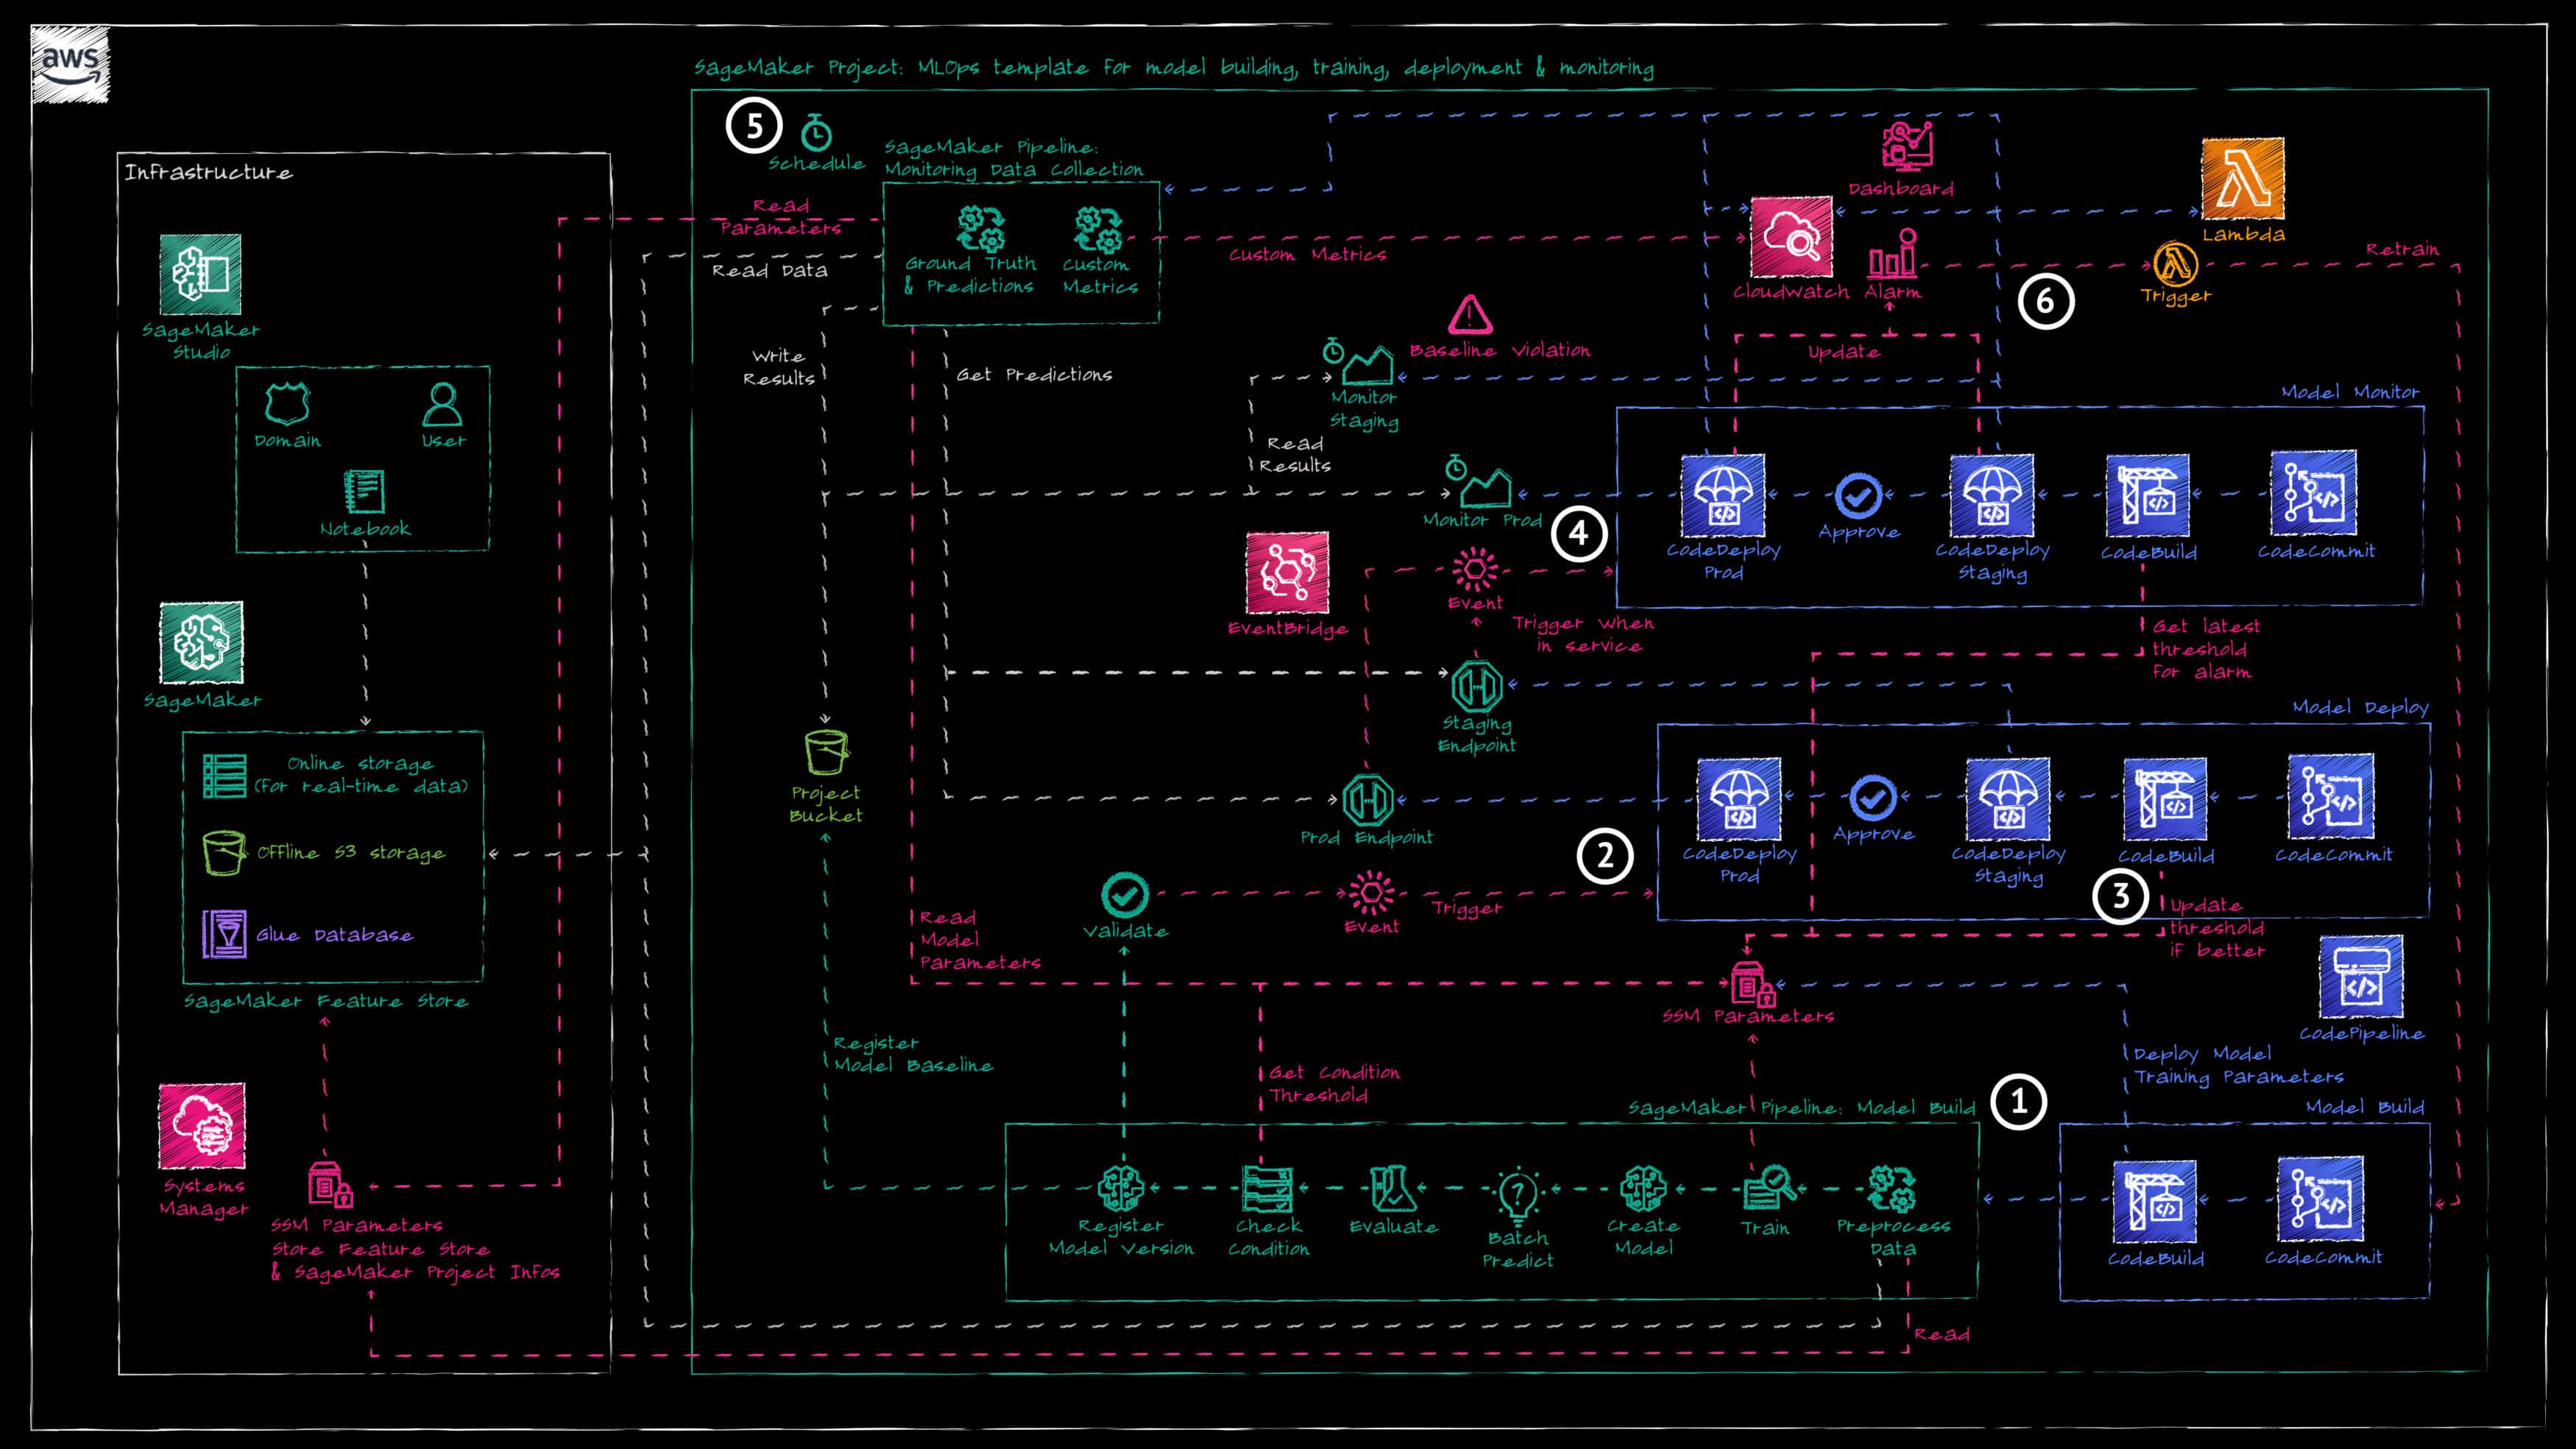
The AWS CodePipeline for deploying monitoring resources is automatically triggered as soon as the SageMaker Endpoint transitions to the "IN_SERVICE" state (Reference 4).
SageMaker provides built-in model monitoring capabilities utilized by our framework. There are four different monitor types that can be enabled and configured: Data Quality, Model Quality, Model Explainability, and Model Bias.
In this demo, we employ only the model quality monitoring job (see AWS documentation), which involves two SageMaker processing jobs (Reference 5):
- Ground Truth Merge: This job merges predictions captured from real-time or batch inference with actual values stored in an S3 Bucket. It uses the event ID to match ground-truth data points with the corresponding predictions and outputs the resulting file to the SageMaker project’s S3 Bucket.
- Model Quality Monitoring: This second job uses the output file from the Ground Truth Merge job to compute accuracy metrics based on the defined problem type (Regression, Binary Classification, or Multiclass). These metrics are then compared to the threshold defined in the constraints file generated by the SageMaker pipeline during model training.
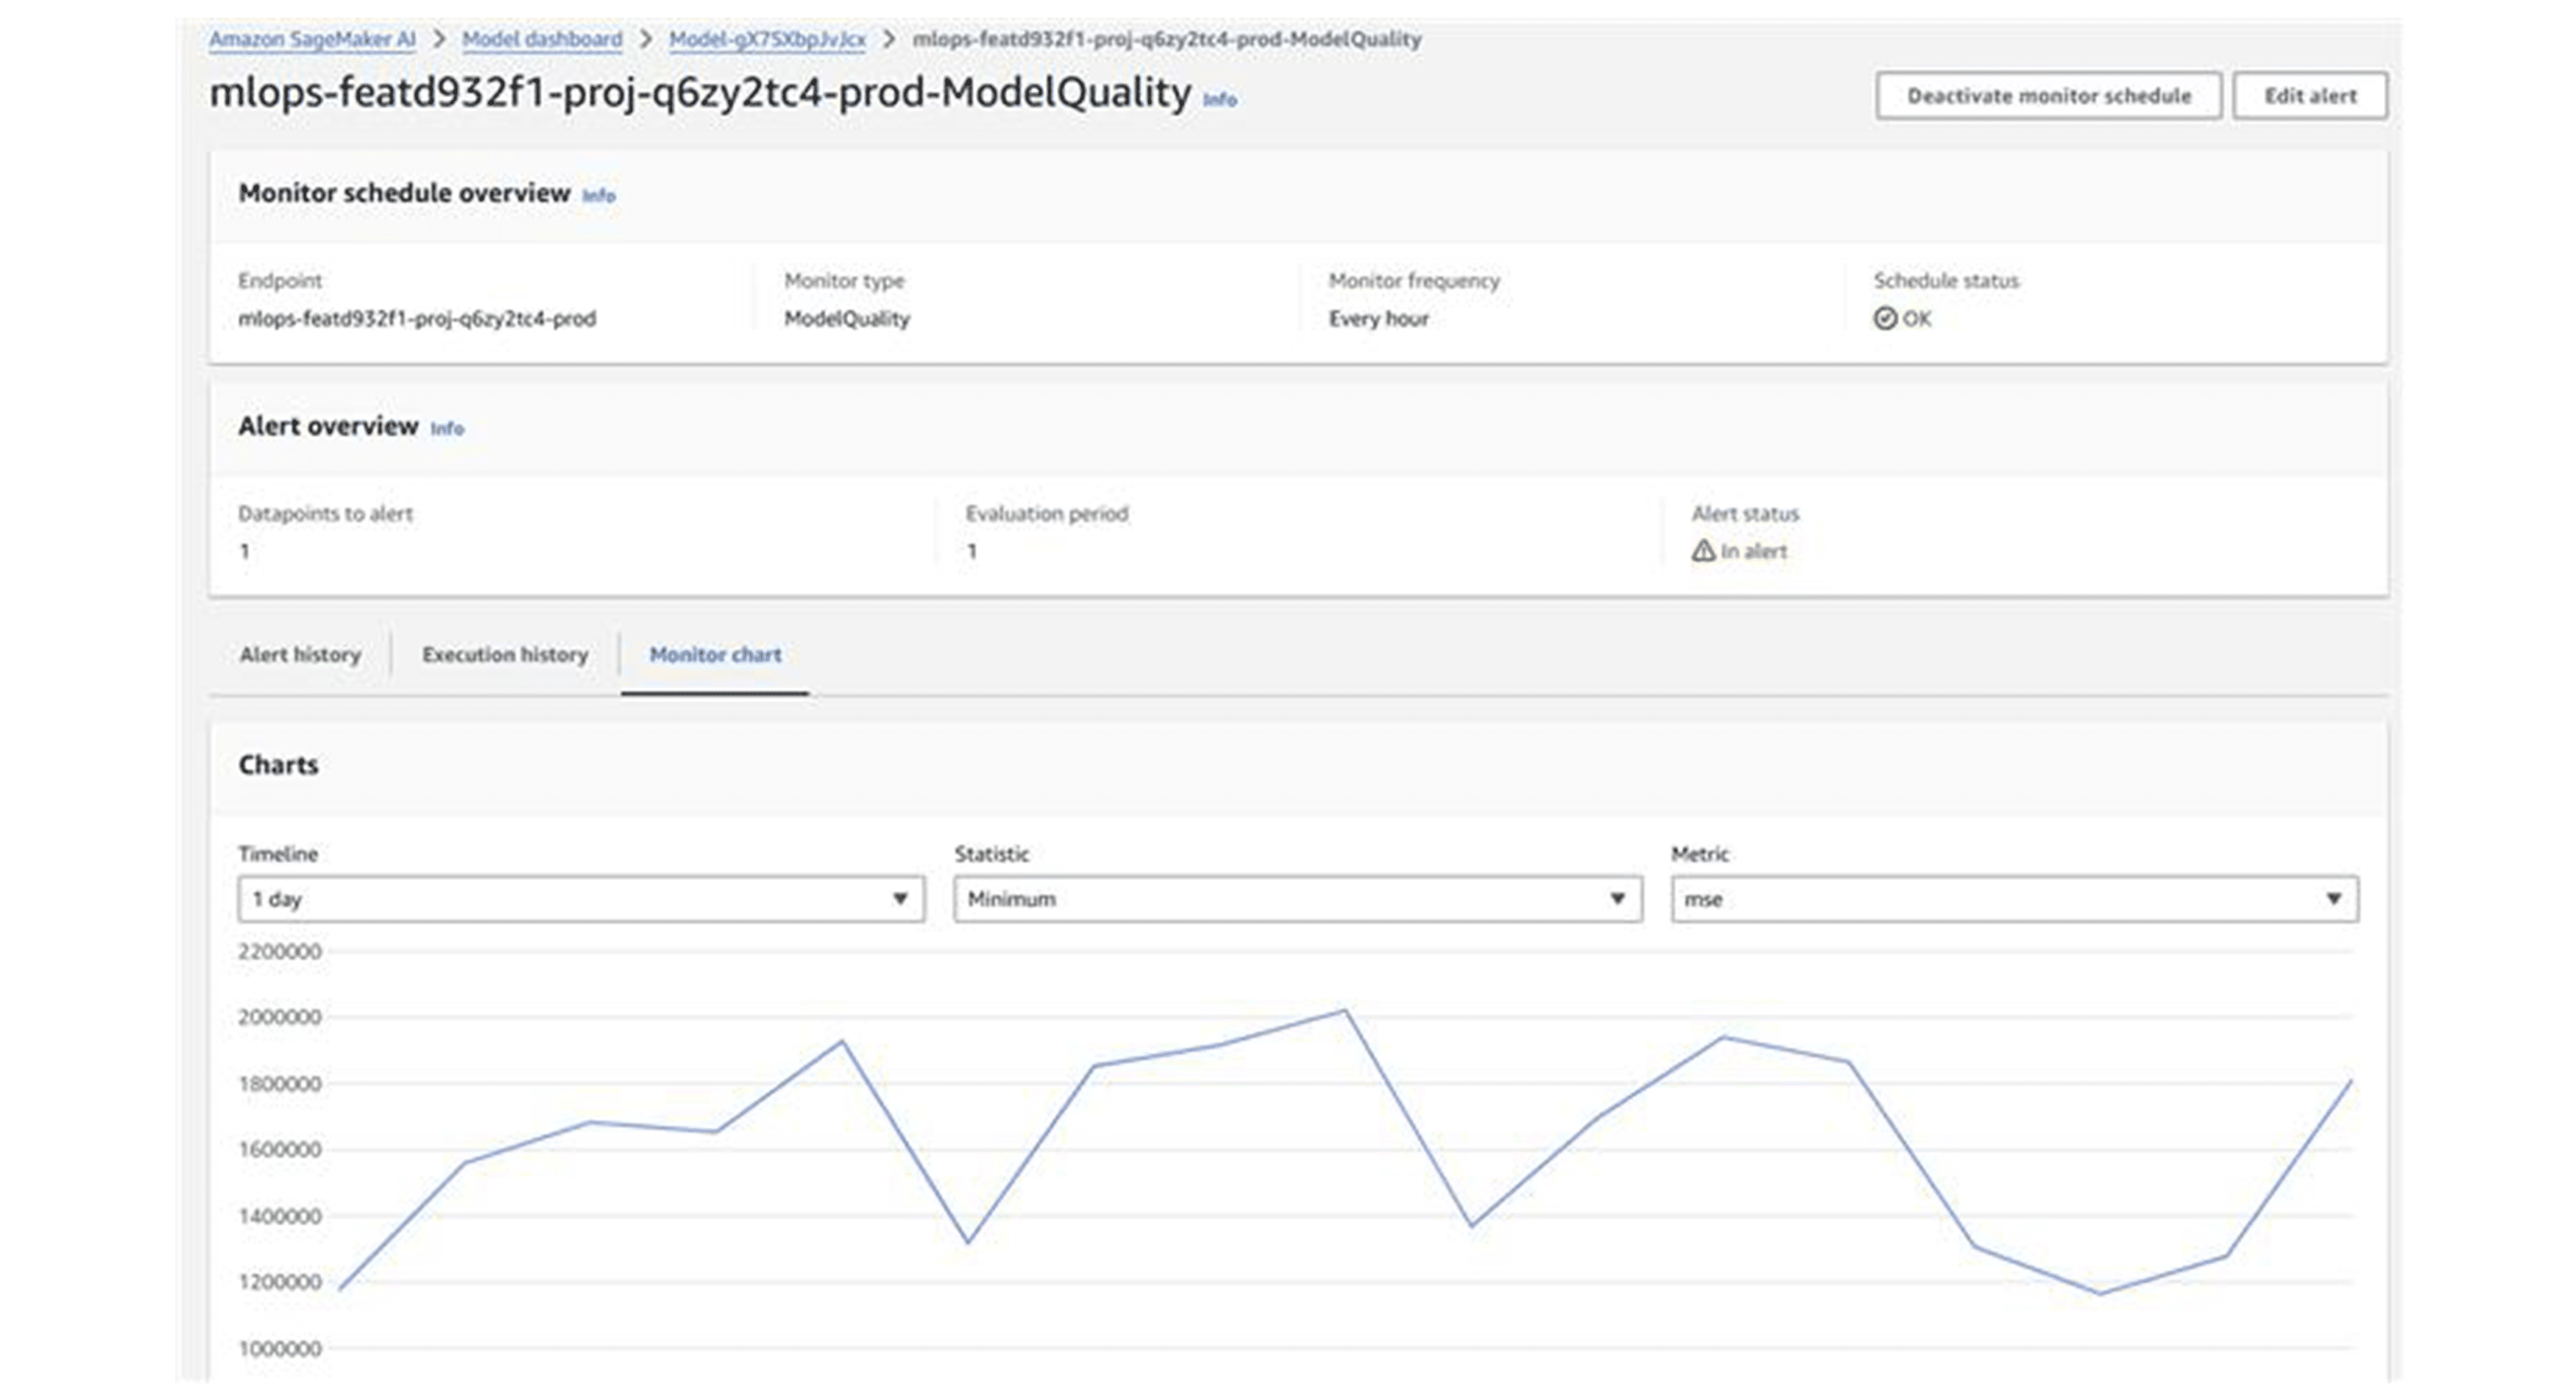
The SageMaker model dashboard provides visibility into all monitoring jobs and their results:
Limitations
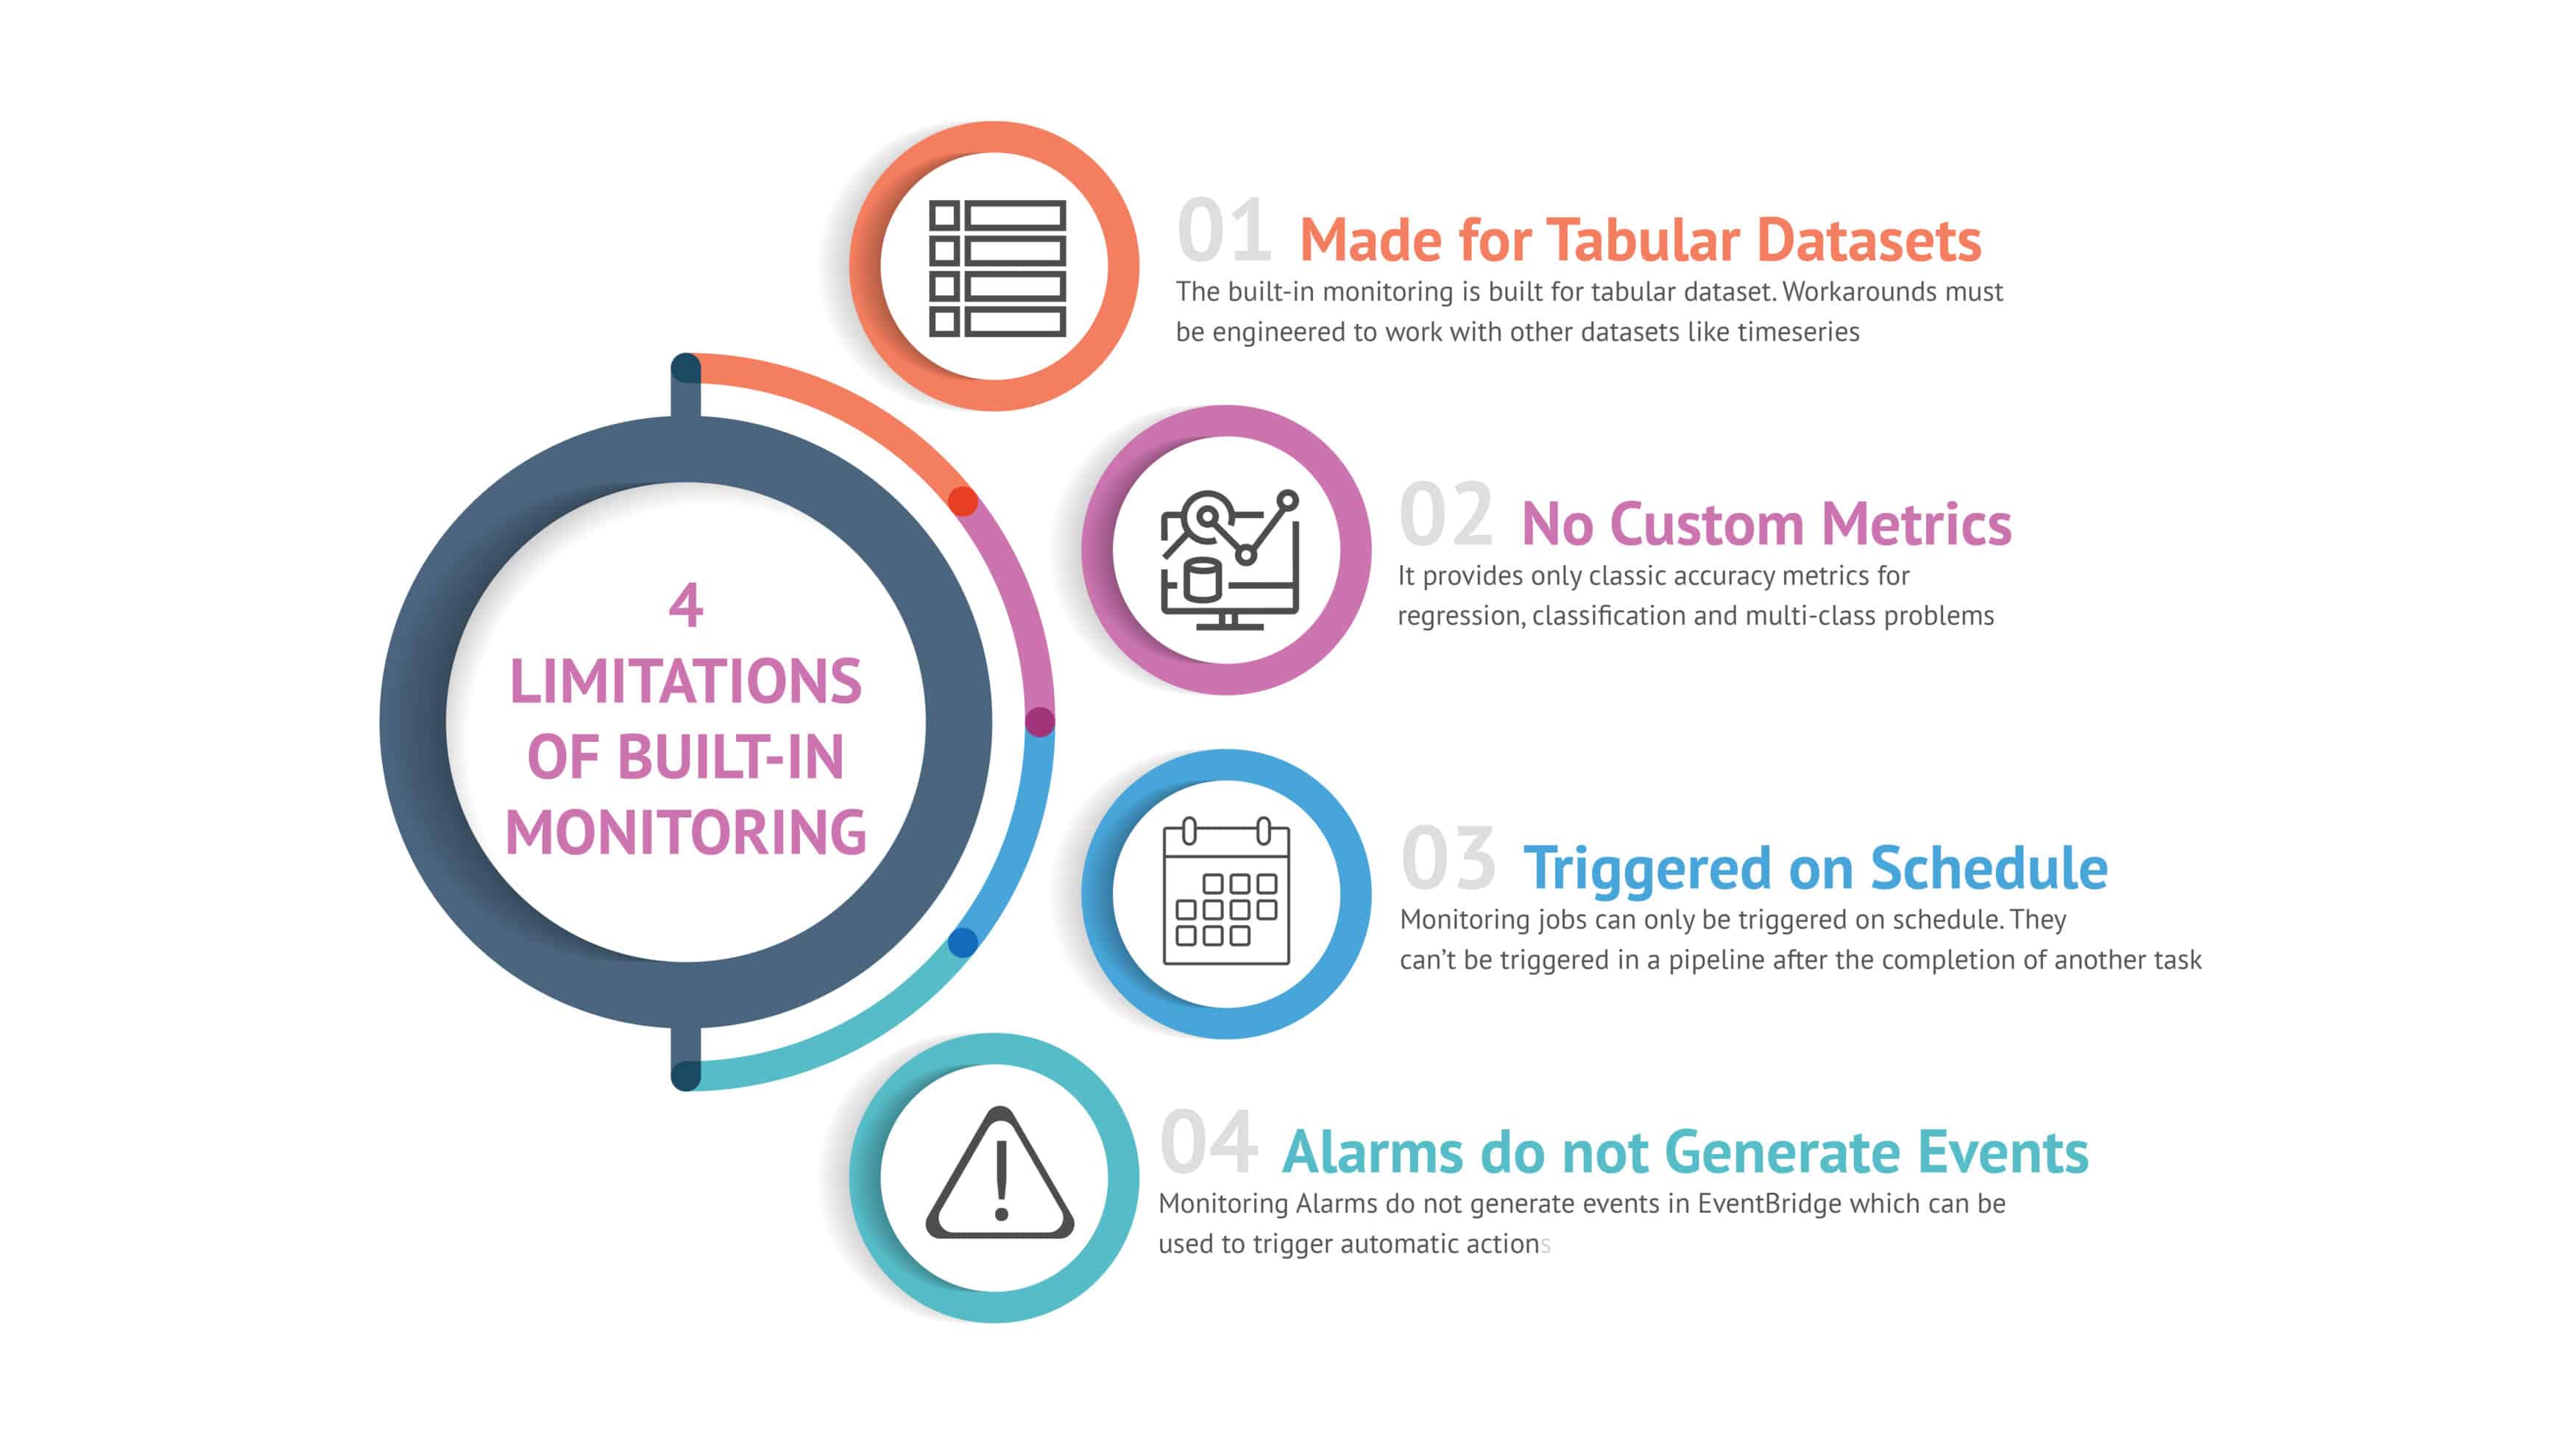
- Made for Tabular Datasets: The dataset for the built-in monitoring has to conform to a strict format. To address this, we created a custom SageMaker Pipeline called “Data Collection” that runs a Python script before the Model Monitoring schedule, to adapt our timeseries dataset to the correct format. This additional pipeline is integrated into the Monitoring Pipeline and is deployed as a part of it.
- No Custom Metrics: The built-in monitoring only allows a handful of metrics for calculating model accuracy for tabular datasets. In our timeseries usecase, we needed to use a different metric to determine if the model is still performing well or if it needs retraining. We added an additional step to our “Data Collection” SageMaker Pipeline, which runs another Python script to calculate the custom metric. The result is then pushed to a Custom CloudWatch metric, enabling it to be read by other AWS services.
- Triggered on Schedule: It is not possible to run the built-in monitoring outside of the CRON schedule, making it difficult to link it before or after other jobs and build automation around it.
- Alarms do not Generate Events: The alarms within the SageMaker model monitoring dashboard do not generate actual AWS events, making it impossible to react to poor model accuracy results by triggering automatic processes. Since we already had the custom CloudWatch metric in place, we added a CloudWatch alarm that checks the metric against a threshold, enabling us to automatically trigger the model retraining.
Model Retraining
One of the main goals of our MLOps Pipeline was to enable automatic model retraining when model accuracy drops below a predefined threshold. Since AWS SageMaker does not provide a built-in solution for this process, we developed the following custom solution:
- Monitoring: As described above, we used a combination of a SageMaker Pipeline job computing a custom metric pushed as custom CloudWatch Metric and a CloudWatch Alarm.
- Lambda Function: A Lambda function is triggered by a CloudWatch Alarm when the model accuracy drops below the threshold. This function initiates the entire MLOps Lifecycle. During the first "Model Build" phase, the pipeline retrains the model. After retraining, the metrics can be validated, and if the new model version performs better than the previous one, it can be manually approved.
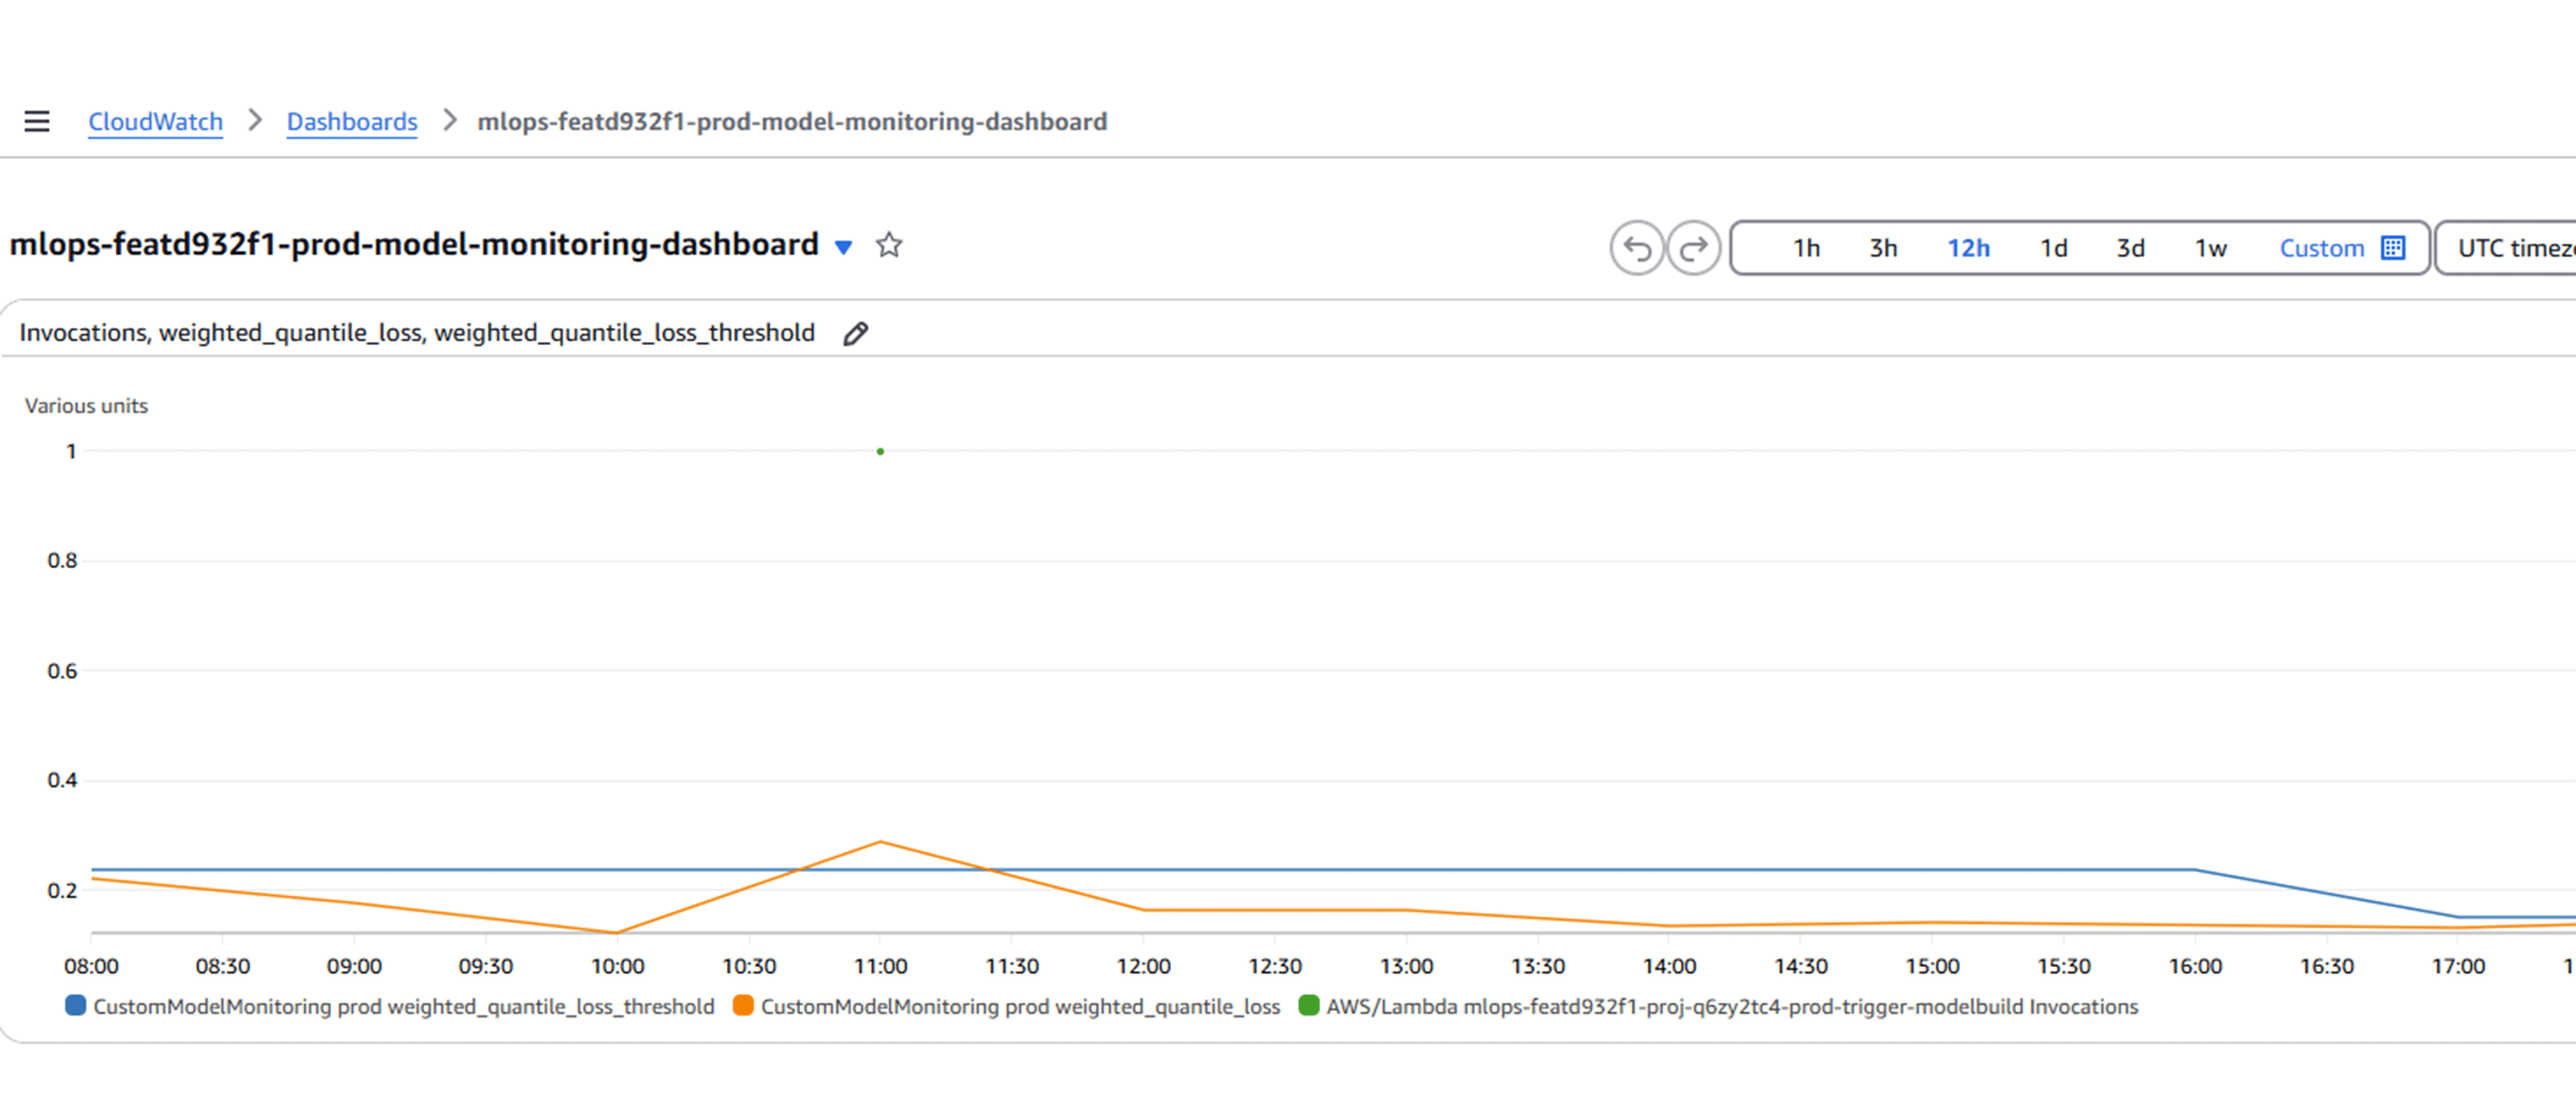
- CloudWatch Dashboard: A custom CloudWatch Dashboard has been set up to display the current threshold (blue), the model accuracy metric (orange), and the instances when the model retraining Lambda function was executed (green dots).
The Conclusion and Lessons learned
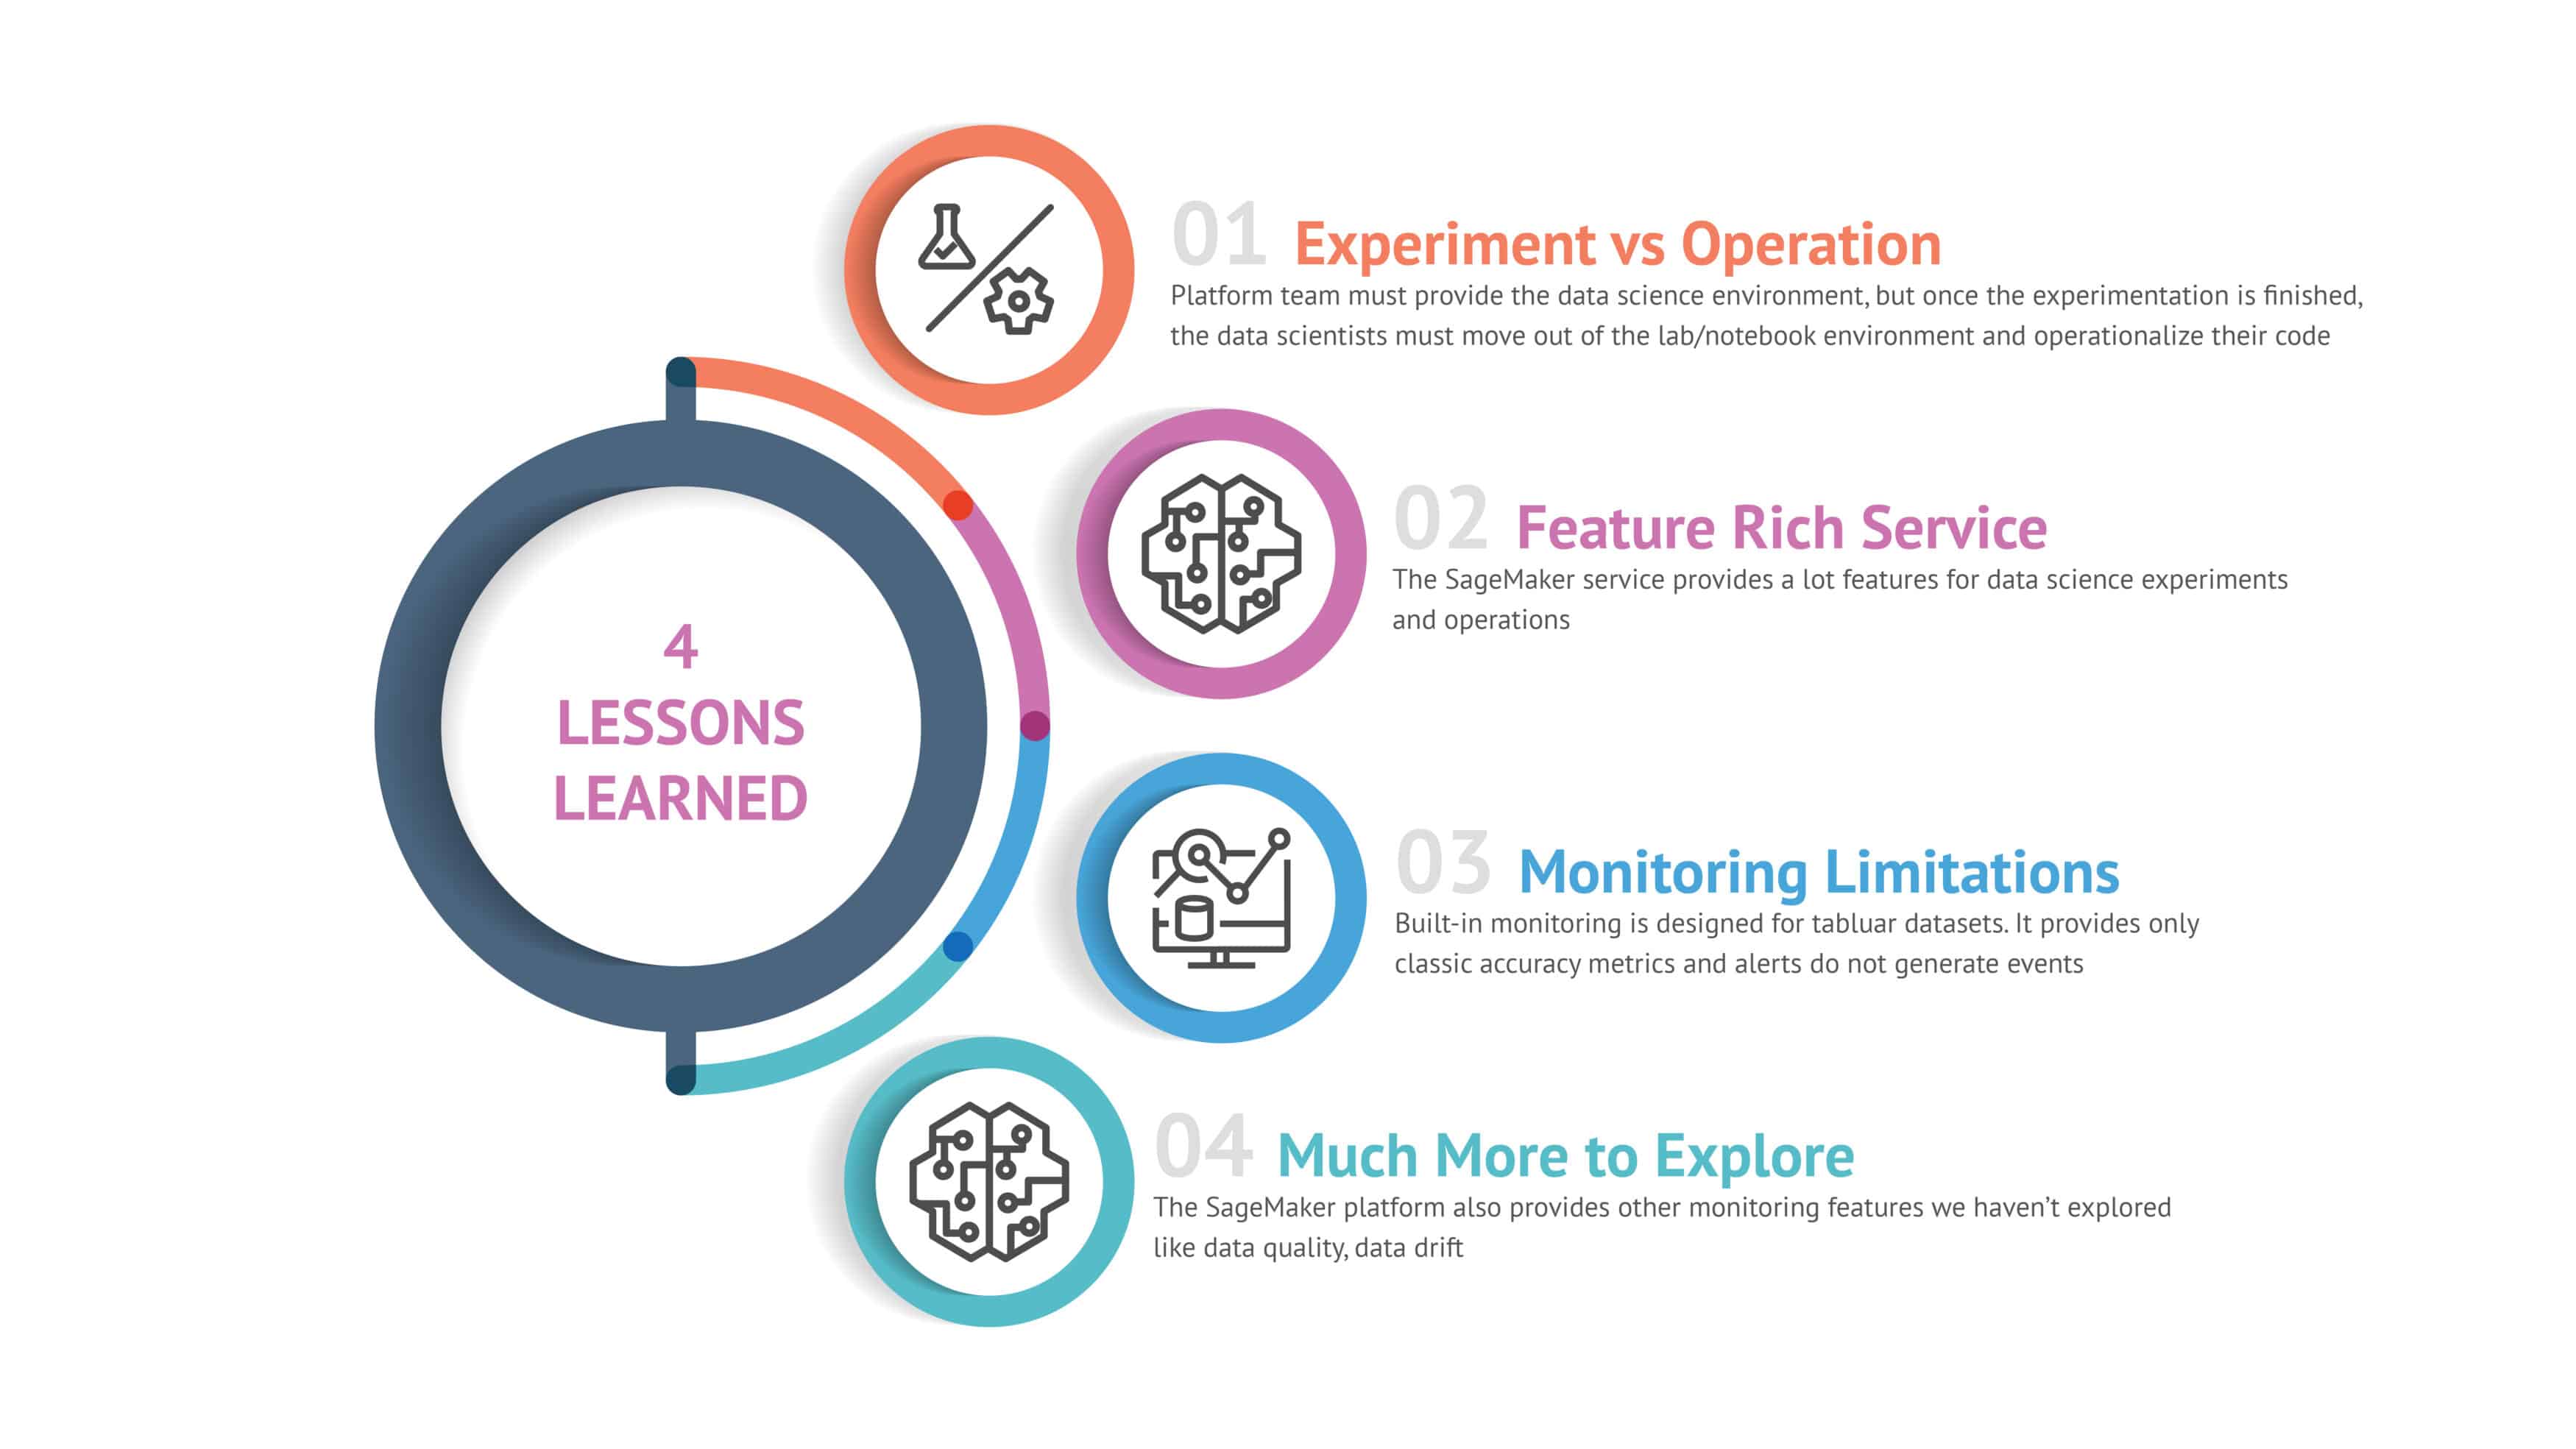
- Experiment vs Operation: One critical lesson is the importance of transitioning from experimentation to operation. The platform team must ensure a robust data science platform is available for experiments. However, once the experimentation phase concludes, data scientists need to move out of their lab or notebook environment and operationalize their code.
- Feature Rich Service: AWS SageMaker proves to be a powerful tool, offering a multitude of features for both data science experiments and operationalization. Its comprehensive suite helps streamline the workflow from development to deployment, making it an invaluable asset for data science teams.
- Monitoring Limitations: SageMaker’ s built-in monitoring has some limitations. It is primarily designed for tabular datasets and provides only classic accuracy metrics. Furthermore, the alert system does not generate events, which could be a drawback for teams needing more dynamic monitoring solutions.
- Much More to Explore: Our journey with SageMaker has shown that there's still a lot more to explore. The platform offers additional monitoring features such as data quality and data drift detection, which we have yet to fully investigate. These tools could provide deeper insights and better control over model performance in production.
In summary, successfully navigating the data science lifecycle requires careful consideration of both the experimentation and operational phases. Leveraging the rich features of platforms like SageMaker, while being mindful of their limitations, can significantly enhance the effectiveness and efficiency of data science projects.


